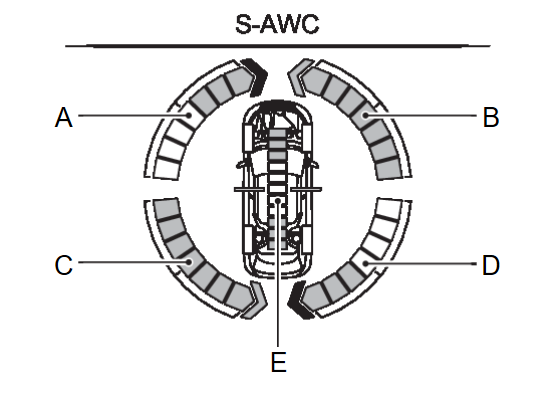
S-AWC OPERATION DISPLAY
DESIGN/PURPOSE
| Design | Purpose |
Yaw moment control display: The amount of the yaw moment control is displayed as a ber graph. A, D: Amount of the yaw moment control in a clockwise direction B, C: Amount of the yaw moment control in a counterclockwise direction | |
Traction control display: The strength of the traction control between front and rear wheels is displayed in section E of the meter as abar graph/ |
| note | The driving force distribution may not match actual one. This is not a system malfunction. |
![[Previous]](../../../buttons/fprev.png)
![[Next]](../../../buttons/fnext.png)
